
Energy, Grid & Markets
From mounting sensors on a transmission corridor for Dynamic Line Rating (DLR) to delivering real-time feeds to quantitative commodity desks — local weather observation supports critical energy operations.
Transmission Corridor Intelligence

Local weather along a transmission corridor.
Overhead transmission line ampacity is constrained by conductor temperature. When ambient winds cool the lines, their safe carrying capacity can increase significantly without structural rebuilds.
Wind speed, direction, and ambient temperature govern conductor cooling. Conditions vary drastically span by span; coarse regional models miss the specific microclimate bottlenecks that dictate line capacity.
WeatherXM deployed high-resolution observation stations along a live transmission corridor in Portugal for Enline, streaming localized wind vectors and ambient thermal telemetry.
Placing measurement directly adjacent to the evaluated conductors validates Dynamic Line Rating (DLR) algorithms, enabling transmission operators to safely unlock line throughput.
Quantitative Power Trading & Analytics
Observations reaching energy traders.
An energy-trading customer obtains WeatherXM observations through Synoptic Data ↗. This demonstrates an immediate route into energy applications: delivering the network's observations directly through platforms the buyer already uses with zero new hardware to manage.
By leveraging Synoptic's established distribution pipeline, quantitative power trading desks consume 1-minute ground-truth temperature, solar, and wind feeds alongside existing ISO and balancing authority data to anticipate price spikes before regional NWP models catch up.
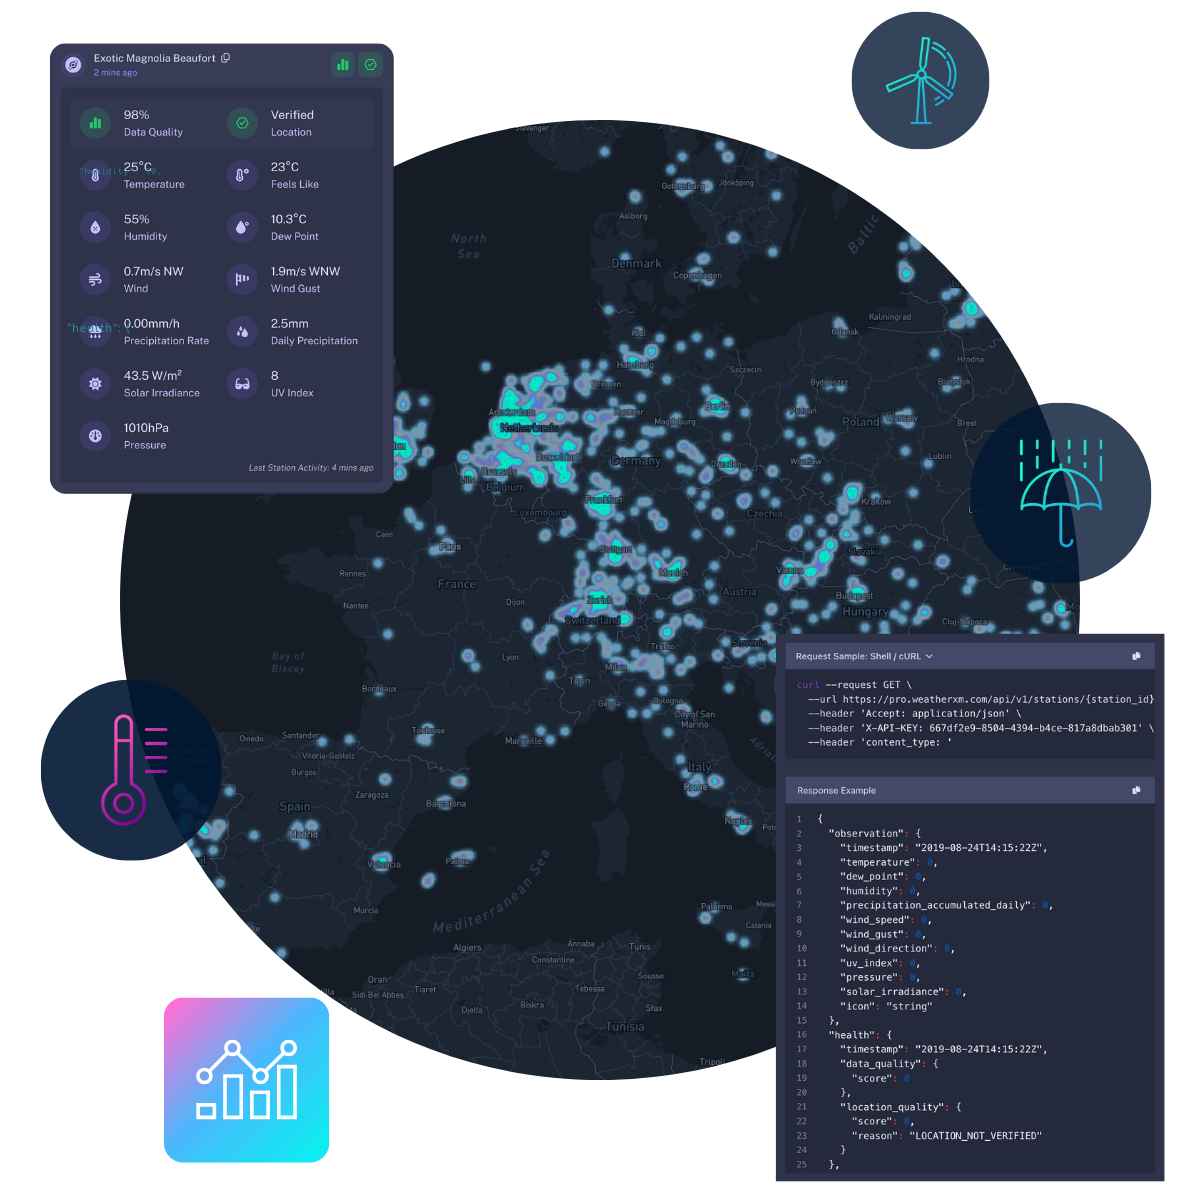
High-Resolution Physical Grid Analytics
Integrating physical observation data directly into power systems operations and risk management.
IEEE 738 Thermal Balance
Real-time cross-wind speed, direction, ambient temperature, and solar irradiance feed dynamic line rating calculations, replacing static seasonal assumptions with measured local cooling.
Solar & wind ramp detection
Ground-level pyranometer and anemometer clusters capture hyper-localized cloud shadow and gust fronts that lead regional forecast models by 15–45 minutes, reducing imbalance penalties.
Substation & node siting
Deploying dense sensor clusters along historical congestion choke points provides empirical validation for dispatch decisions and nodal pricing models.
Ready to discuss an energy-data requirement?
We configure custom corridor deployments and provide direct REST and platform-integrated data feeds for utilities, transmission operators, and trading firms.